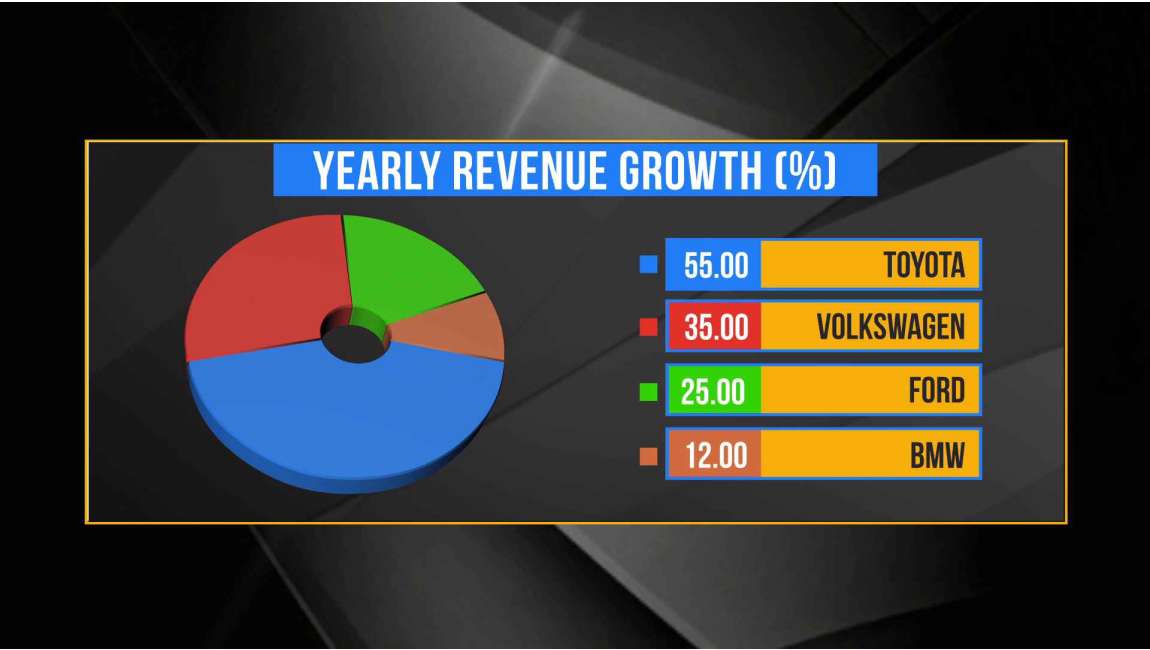
Pie Chart- 4 entries
Product Attributes
| Supported Software | Xpress |
|---|---|
| Fonts Included | Yes |
| Product | Full Frame |
| File Size | 71.7 MB |
The Pie Graph (4 Entries) Template is an essential live graphic designed to present multi-segmented data in an engaging and visually compelling format. With four distinct sections, this template allows for a clear and concise breakdown of statistics, comparisons, and analytical insights, making it a valuable tool for broadcasters, educators, financial analysts, and content creators.
Whether you're displaying market share data, audience demographics, survey results, or financial reports, this template provides a structured and easy-to-understand visual representation of your data. The animated transitions ensure smooth integration into any news segment, business presentation, or educational session, keeping viewers engaged while absorbing key insights.
Key Features:
✔ 4-Segment Pie Chart – Perfect for displaying multi-category data points.
✔ Live Data Representation – Easily update figures in real time.
✔ Customizable Design – Adjust colors, labels, and segment sizes to match your branding.
✔ Smooth Animations – Ensures a professional and polished look.
✔ Multi-Use Application – Ideal for poll results, financial analysis, sales distribution, audience insights, and more.
With this template, you can present complex data in a simplified, digestible format that enhances audience understanding. Whether used in news reports, corporate meetings, sports analytics, or election coverage, the Pie Graph (4 Entries) Template adds a professional touch to your live stream, making data storytelling both engaging and informative.


