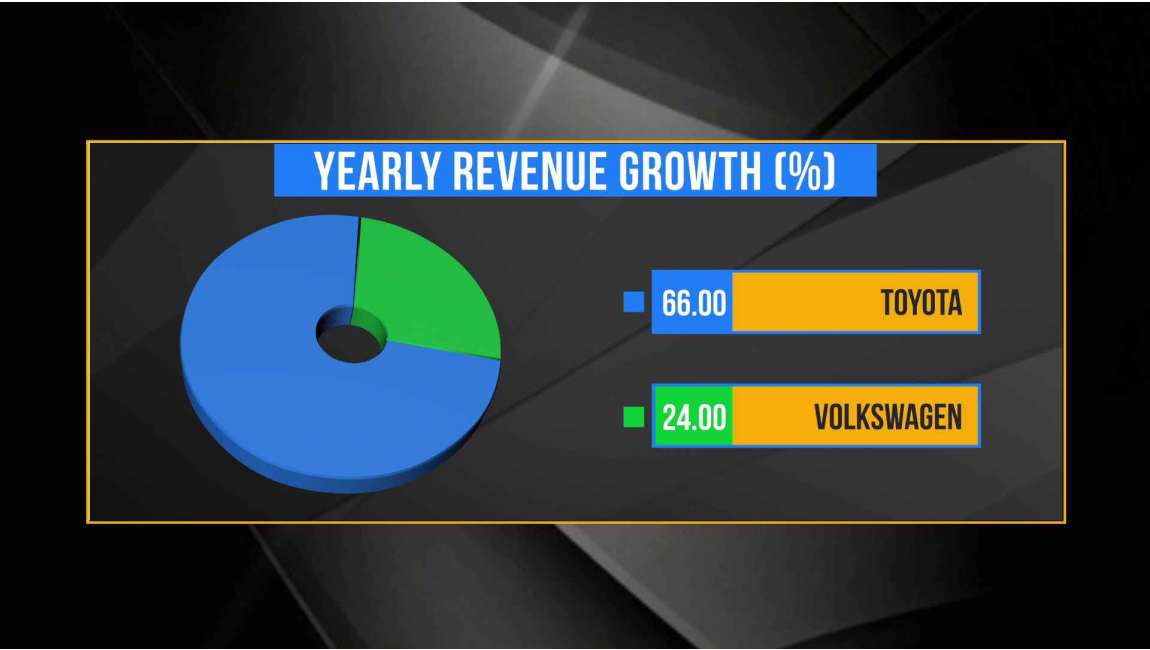
Pie Chart- 2 entries
Product Attributes
| Supported Software | Xpress |
|---|---|
| Fonts Included | Yes |
| Product | Full Frame, Infographics |
| File Size | 71.8 MB |
Make complex data simple and visually appealing with the Dual Data Pie Chart – Live Streaming Template. Designed for broadcasters, analysts, and presenters, this template allows you to showcase two distinct data sets in an intuitive and engaging pie chart format. Whether you’re comparing statistics, breaking down market trends, or presenting survey results, this template ensures that your audience grasps key insights instantly.
With smooth animations and real-time updates, the Dual Data Pie Chart dynamically adapts to new information, making it ideal for news channels, financial updates, sports analytics, educational streams, and corporate presentations. The clear segmentation highlights the relationship between the two data sets, ensuring a professional and polished visual presentation.
Customization is at your fingertips—adjust colors, labels, and animations to fit your brand’s theme. The live-updating feature ensures that your data remains accurate and up to date, keeping your audience informed with the latest insights. Whether you’re presenting election results, company performance, sports statistics, or any other analytical comparison, this template brings clarity and engagement to your live streams.
Upgrade your data storytelling with the Dual Data Pie Chart – Live Streaming Template—because great visuals make data more impactful!


