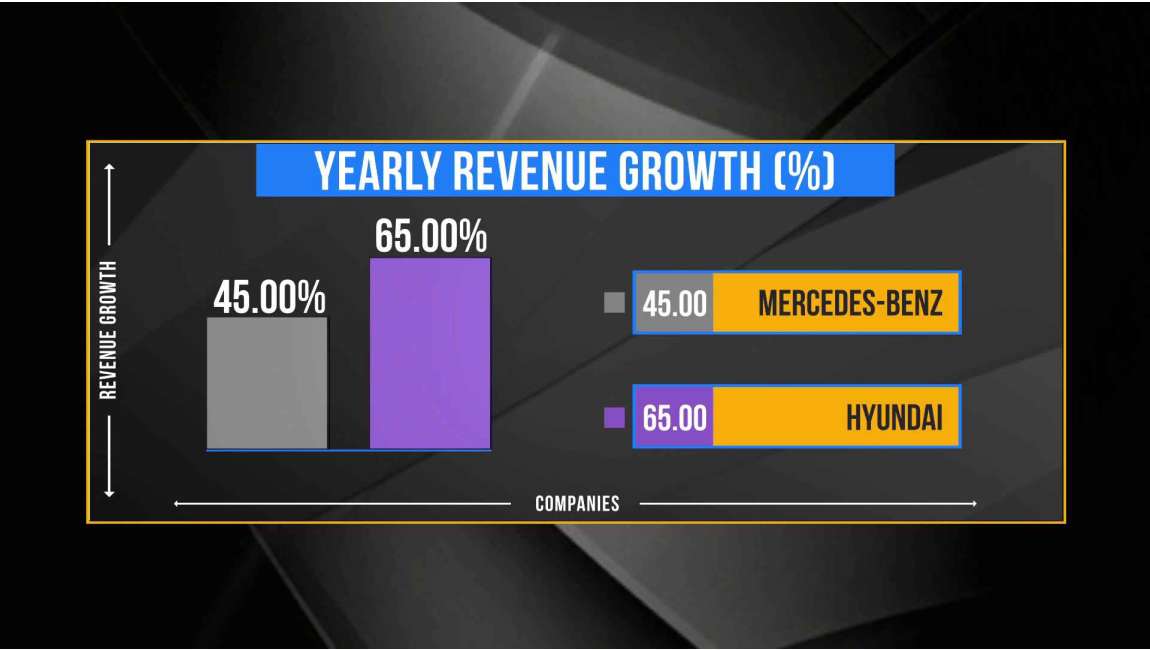
Bar Graph- 2 entries
Product Attributes
| Supported Software | Xpress |
|---|---|
| Fonts Included | Yes |
| Product | Full Frame, Infographics |
| File Size | 73.4 MB |
Transform complex data into engaging visuals with the Bar Graph – Dual Entry Template, designed for real-time comparisons in live streams. Whether you're analyzing election results, comparing sales figures, tracking poll responses, or showcasing performance metrics, this dynamic infographic delivers clear, impactful insights at a glance.
This template features two side-by-side bar entries, allowing you to compare two different values visually. With smooth animations and customizable colors, fonts, and sizes, the design seamlessly blends into any live broadcast. The intuitive layout ensures that your audience can easily grasp key takeaways without overwhelming numbers or cluttered visuals.
Perfect for news broadcasts, sports updates, financial reports, gaming leaderboards, or educational presentations, the Bar Graph – Dual Entry Template makes data-driven storytelling more engaging. Integrated with real-time data sources, it updates instantly to reflect live statistics, ensuring your stream stays current and interactive.
Built for efficiency and flexibility, this template supports custom labels, dynamic scaling, and transition effects to create a professional and visually appealing experience. Whether you're hosting a corporate webinar, a competitive event, or a live analysis session, this infographic enhances clarity and audience engagement.
Bring your data to life with Bar Graph – Dual Entry Template—because numbers tell a better story when they move!


