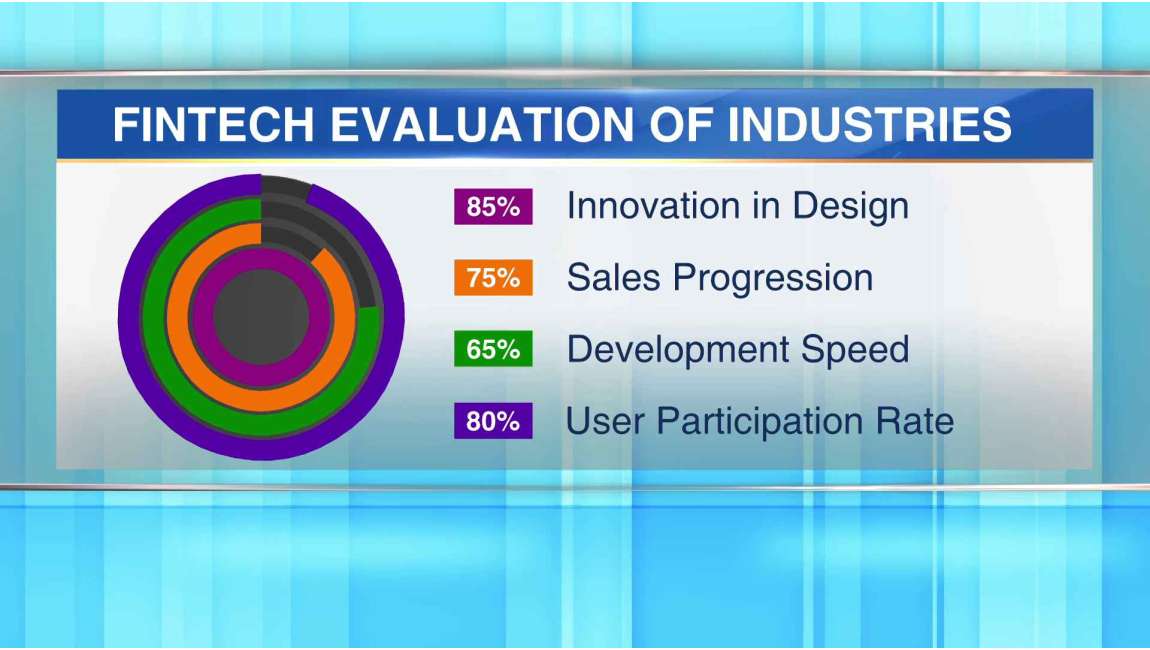
Pie Chart
Product Attributes
| Supported Software | Xpress |
|---|---|
| Fonts Included | Yes |
| Product | Full Frame |
| File Size | 84.8 MB |
The Pie Chart Template is a dynamic live graphic designed to make complex data engaging and digestible for your audience. Whether you’re presenting market trends, financial breakdowns, voting percentages, or performance metrics, this template transforms numbers into visually appealing graphics that leave a lasting impact.
Crafted with a modern, professional look, the Pie Chart Template ensures that key insights stand out while seamlessly integrating with your broadcast. With smooth animations and real-time updates, viewers can track changes effortlessly. Each segment is color-coded and labeled, making it easy to interpret data at a glance.
Key Features
✔ Real-Time Updates – Display dynamic values for live analytics and evolving statistics.
✔ Elegant Animations – Ensure smooth transitions that enhance the viewing experience.
✔ Fully Customizable – Adjust colors, labels, and sizes to match your branding.
✔ Multi-Industry Use – Perfect for news, sports, finance, elections, education, and corporate presentations.
This template is more than just a chart—it’s a storytelling tool, helping presenters convey crucial information clearly and effectively. Designed for broadcasters, analysts, and content creators, the Pie Chart Template ensures that your data doesn’t just inform—it captivates.


